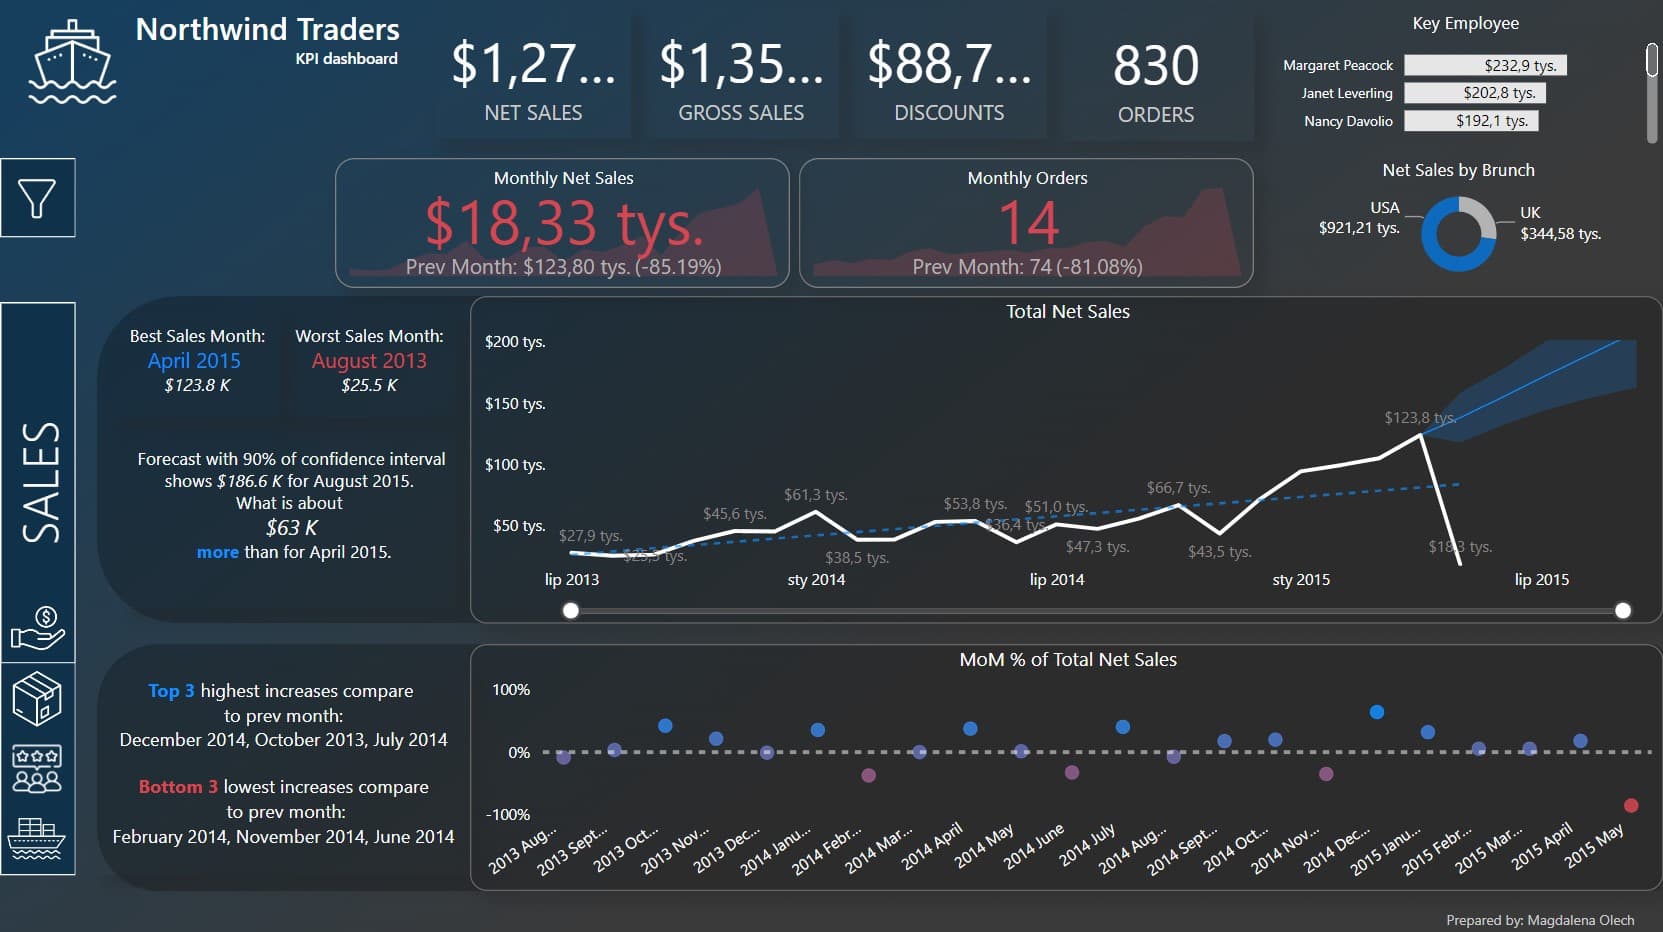
Northwind Traders
A top-level KPI dashboard made to help Northwind Traders' executives quickly understand the company's performance in key areas.
See more
Analyzing data is like solving puzzles with insights as the reward.
A top-level KPI dashboard made to help Northwind Traders' executives quickly understand the company's performance in key areas.
See more